Agent Study
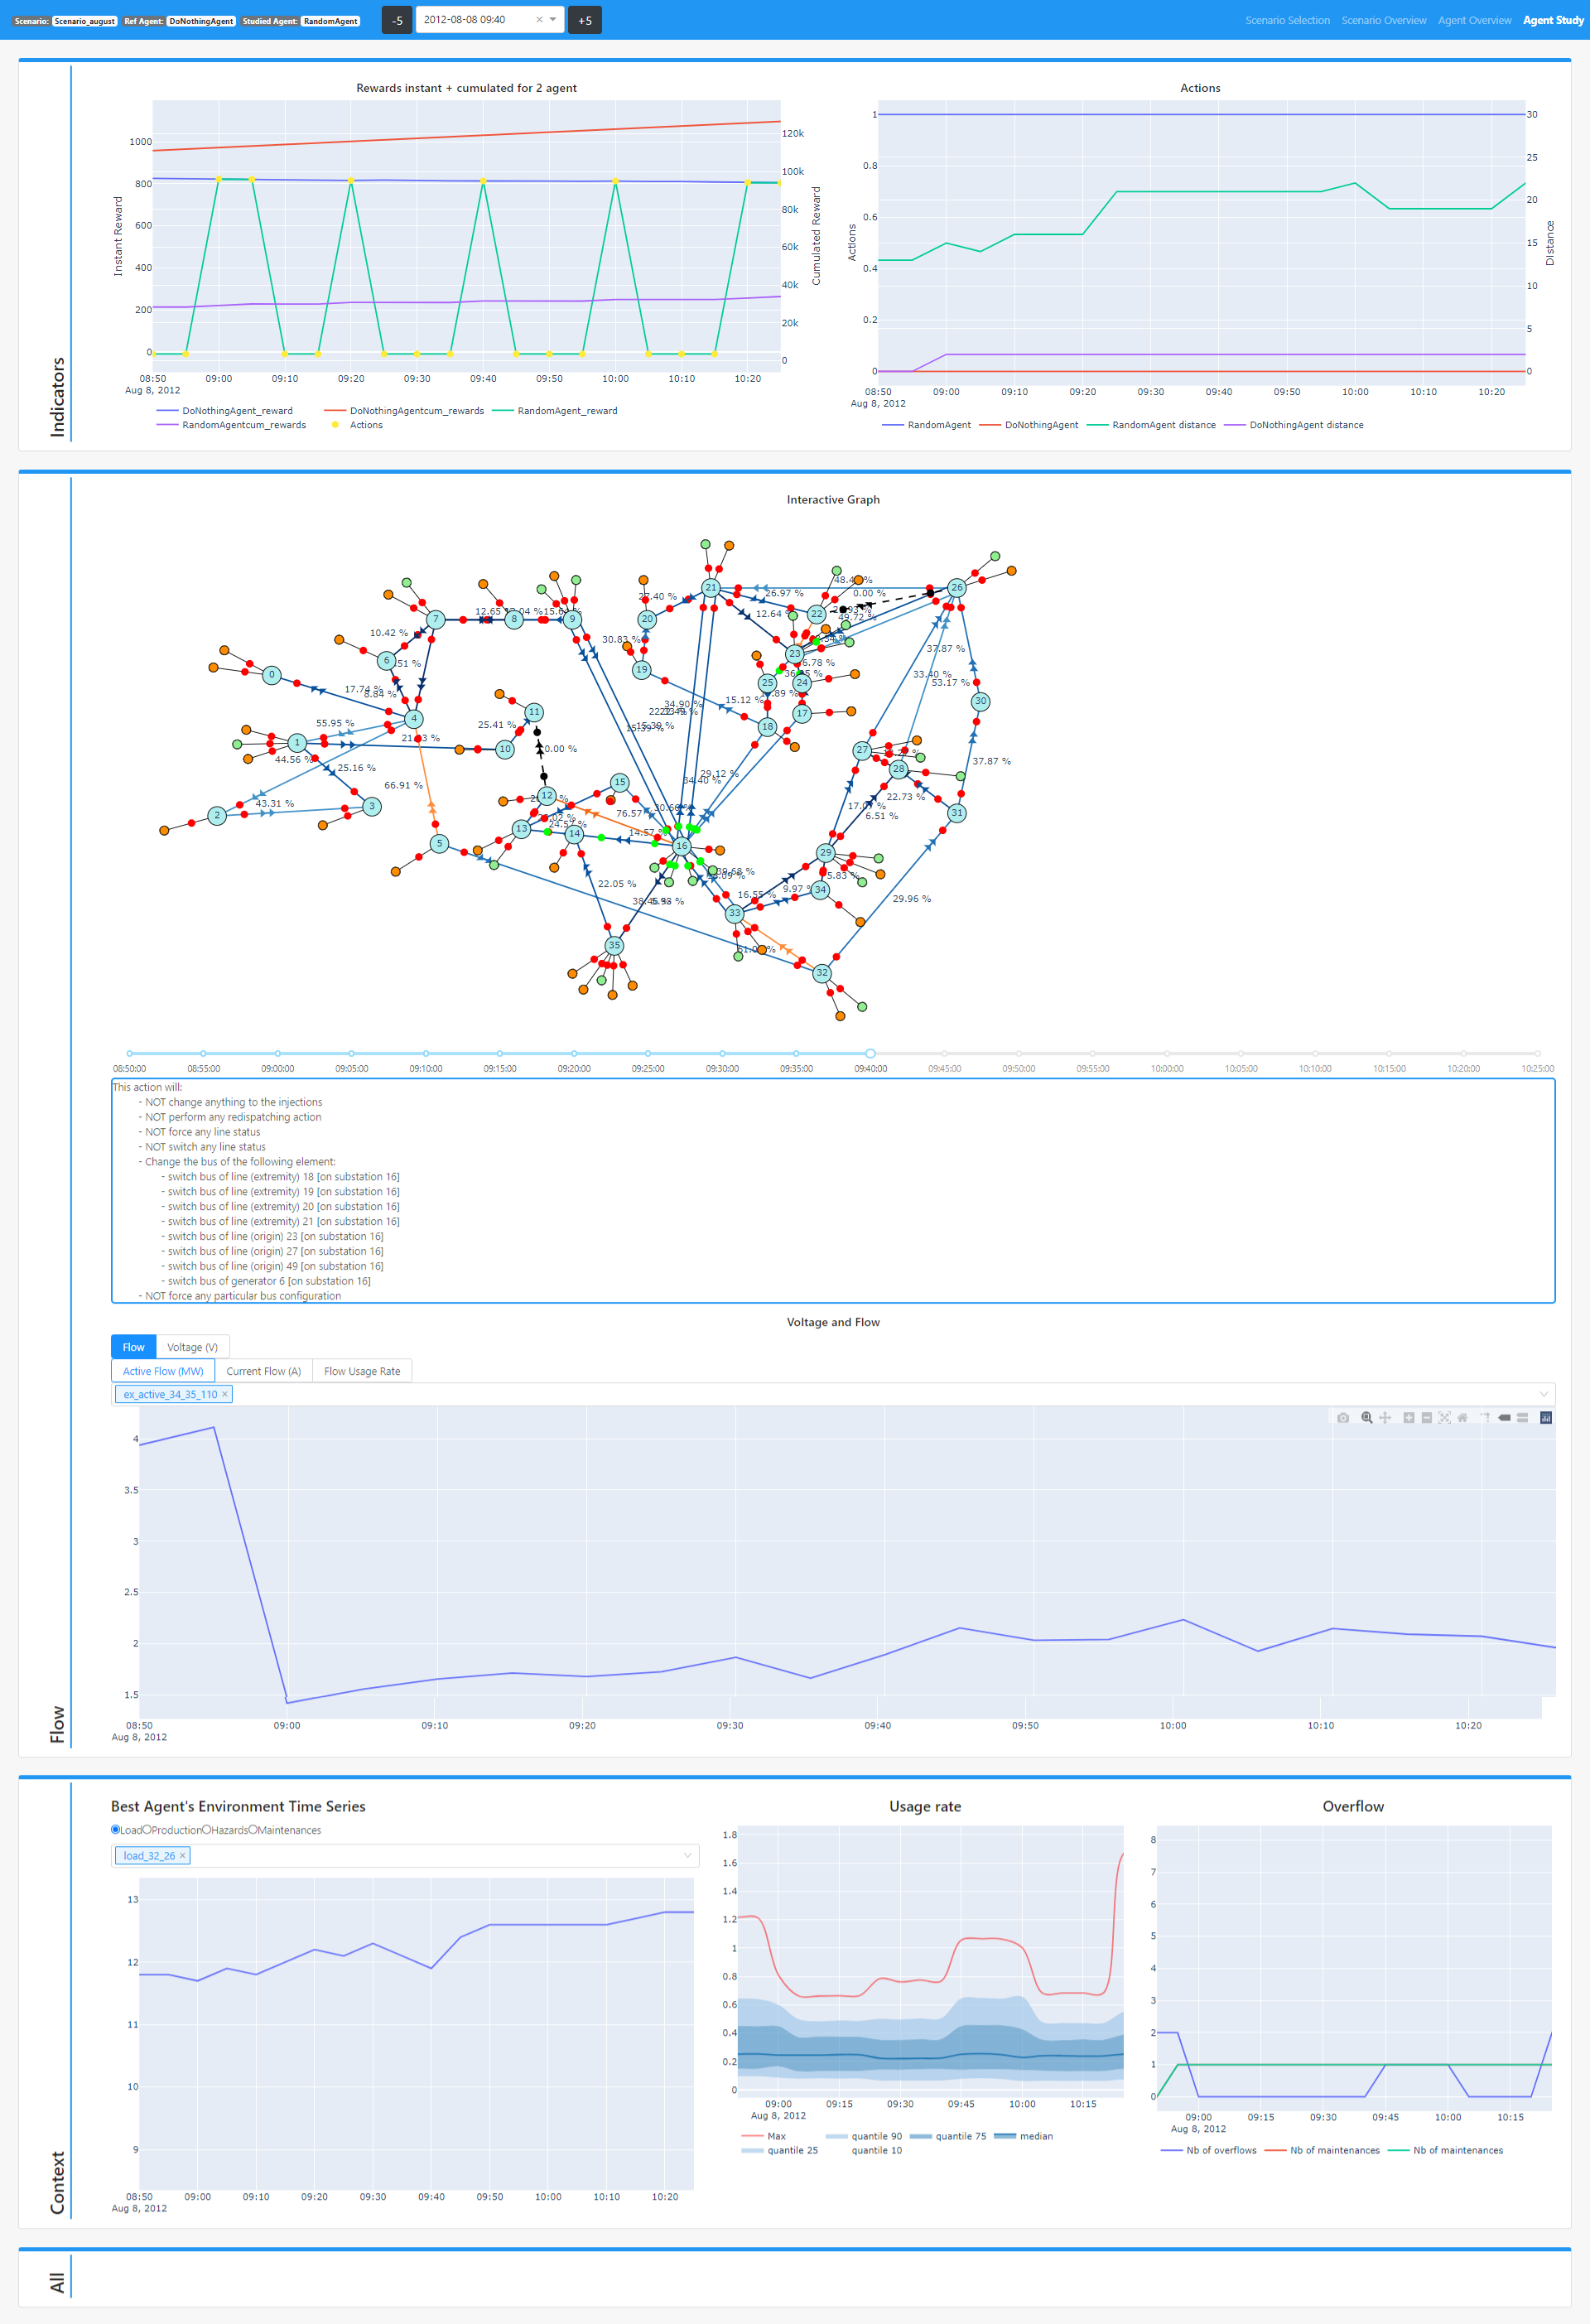
The Agent Study view allows to explore further around a time step of interest the actions taken by an agent and their impacts. The view is composed of three main sections described below.
The navbar displays for this view a special component, namely a time frame selector. It is composed of a dropdown menu allowing to select one of the time step extracted from the Agent Overview view. The -5 and +5 buttons allows to extend the default time frame (10 timesteps on each side of the selected time step).
Indicators
This section displays the same Instant and Cumulated Reward and Actions graphs as the Agent Overview view, but centered around the selected time step.
Flow
This sections provides a Grid2Op plot representation of the grid. A slider, on the same time frame as the Indicators graphs allows to navigate between the corresponding grid states. The string representation of the action for a given time step is again provided below the slider.
The section is completed with a collection of time series representing flows accross lines (either in MW, Amps or usage rate) and voltages.
Context
The Context section is a useful reminder of the environment time series, as seen by the studied agent, the usage rate graph and the overflows and maintenances graph. It is intended to help explore in greater details the context in which an action was taken to have a comprehensive understanding of the situation.